


Bitcoin’s price is currently hovering around 45% below its all-time high of $126,080, signaling a challenging market environment in recent months. The breach of the 365-day moving average to the downside late last year further confirmed the onset of a bear market. A prominent crypto researcher has now presented an analysis comparing the current Bitcoin bear market to previous ones.
Bitcoin Price Falls 30% Below 365-Day Moving Average

In a recent social media post on X, CryptoQuant’s research head Julio Moreno highlighted the performance of the current bear market in comparison to Bitcoin’s historical patterns. The key metric under scrutiny in this assessment is the 365-day simple moving average (SMA) on the BTC price chart.
Moreno identified the beginning of the bear market as the point when Bitcoin’s price dropped below the 365-day SMA. According to the on-chain expert, the leading cryptocurrency has declined by 30% thus far in this phase, making it one of the most severe bear markets in recent memory.

Source: @jjcmoreno on X
As depicted in the above chart, Bitcoin’s price is currently deeper than usual at this stage of the bear market. During the 2014 bear market, the flagship cryptocurrency was only down by around 20% at a similar stage.
A similar scenario unfolded during the 2018 bear market, with the price decline hovering around 20% at this point. However, during the 2022 bear market, Bitcoin faced even greater pressure, as it was down nearly 60% from its 365-day moving average at this juncture.
This trend is intriguing, especially considering Bitcoin’s perceived maturity as an asset class. Despite this, the primary cryptocurrency continues to experience significant volatility at the onset of bear markets.
While the timing of Bitcoin’s price bottom remains uncertain, certain prerequisites must be met for a potential reversal. One crucial factor is the apparent demand metric, which has deteriorated in recent weeks. The outflow figures from US-based Bitcoin ETFs indicate significant capital constraints affecting the leading cryptocurrency.
Bitcoin Price Overview
At present, Bitcoin is trading around $70,500, reflecting a more than 2% increase in the past 24 hours.
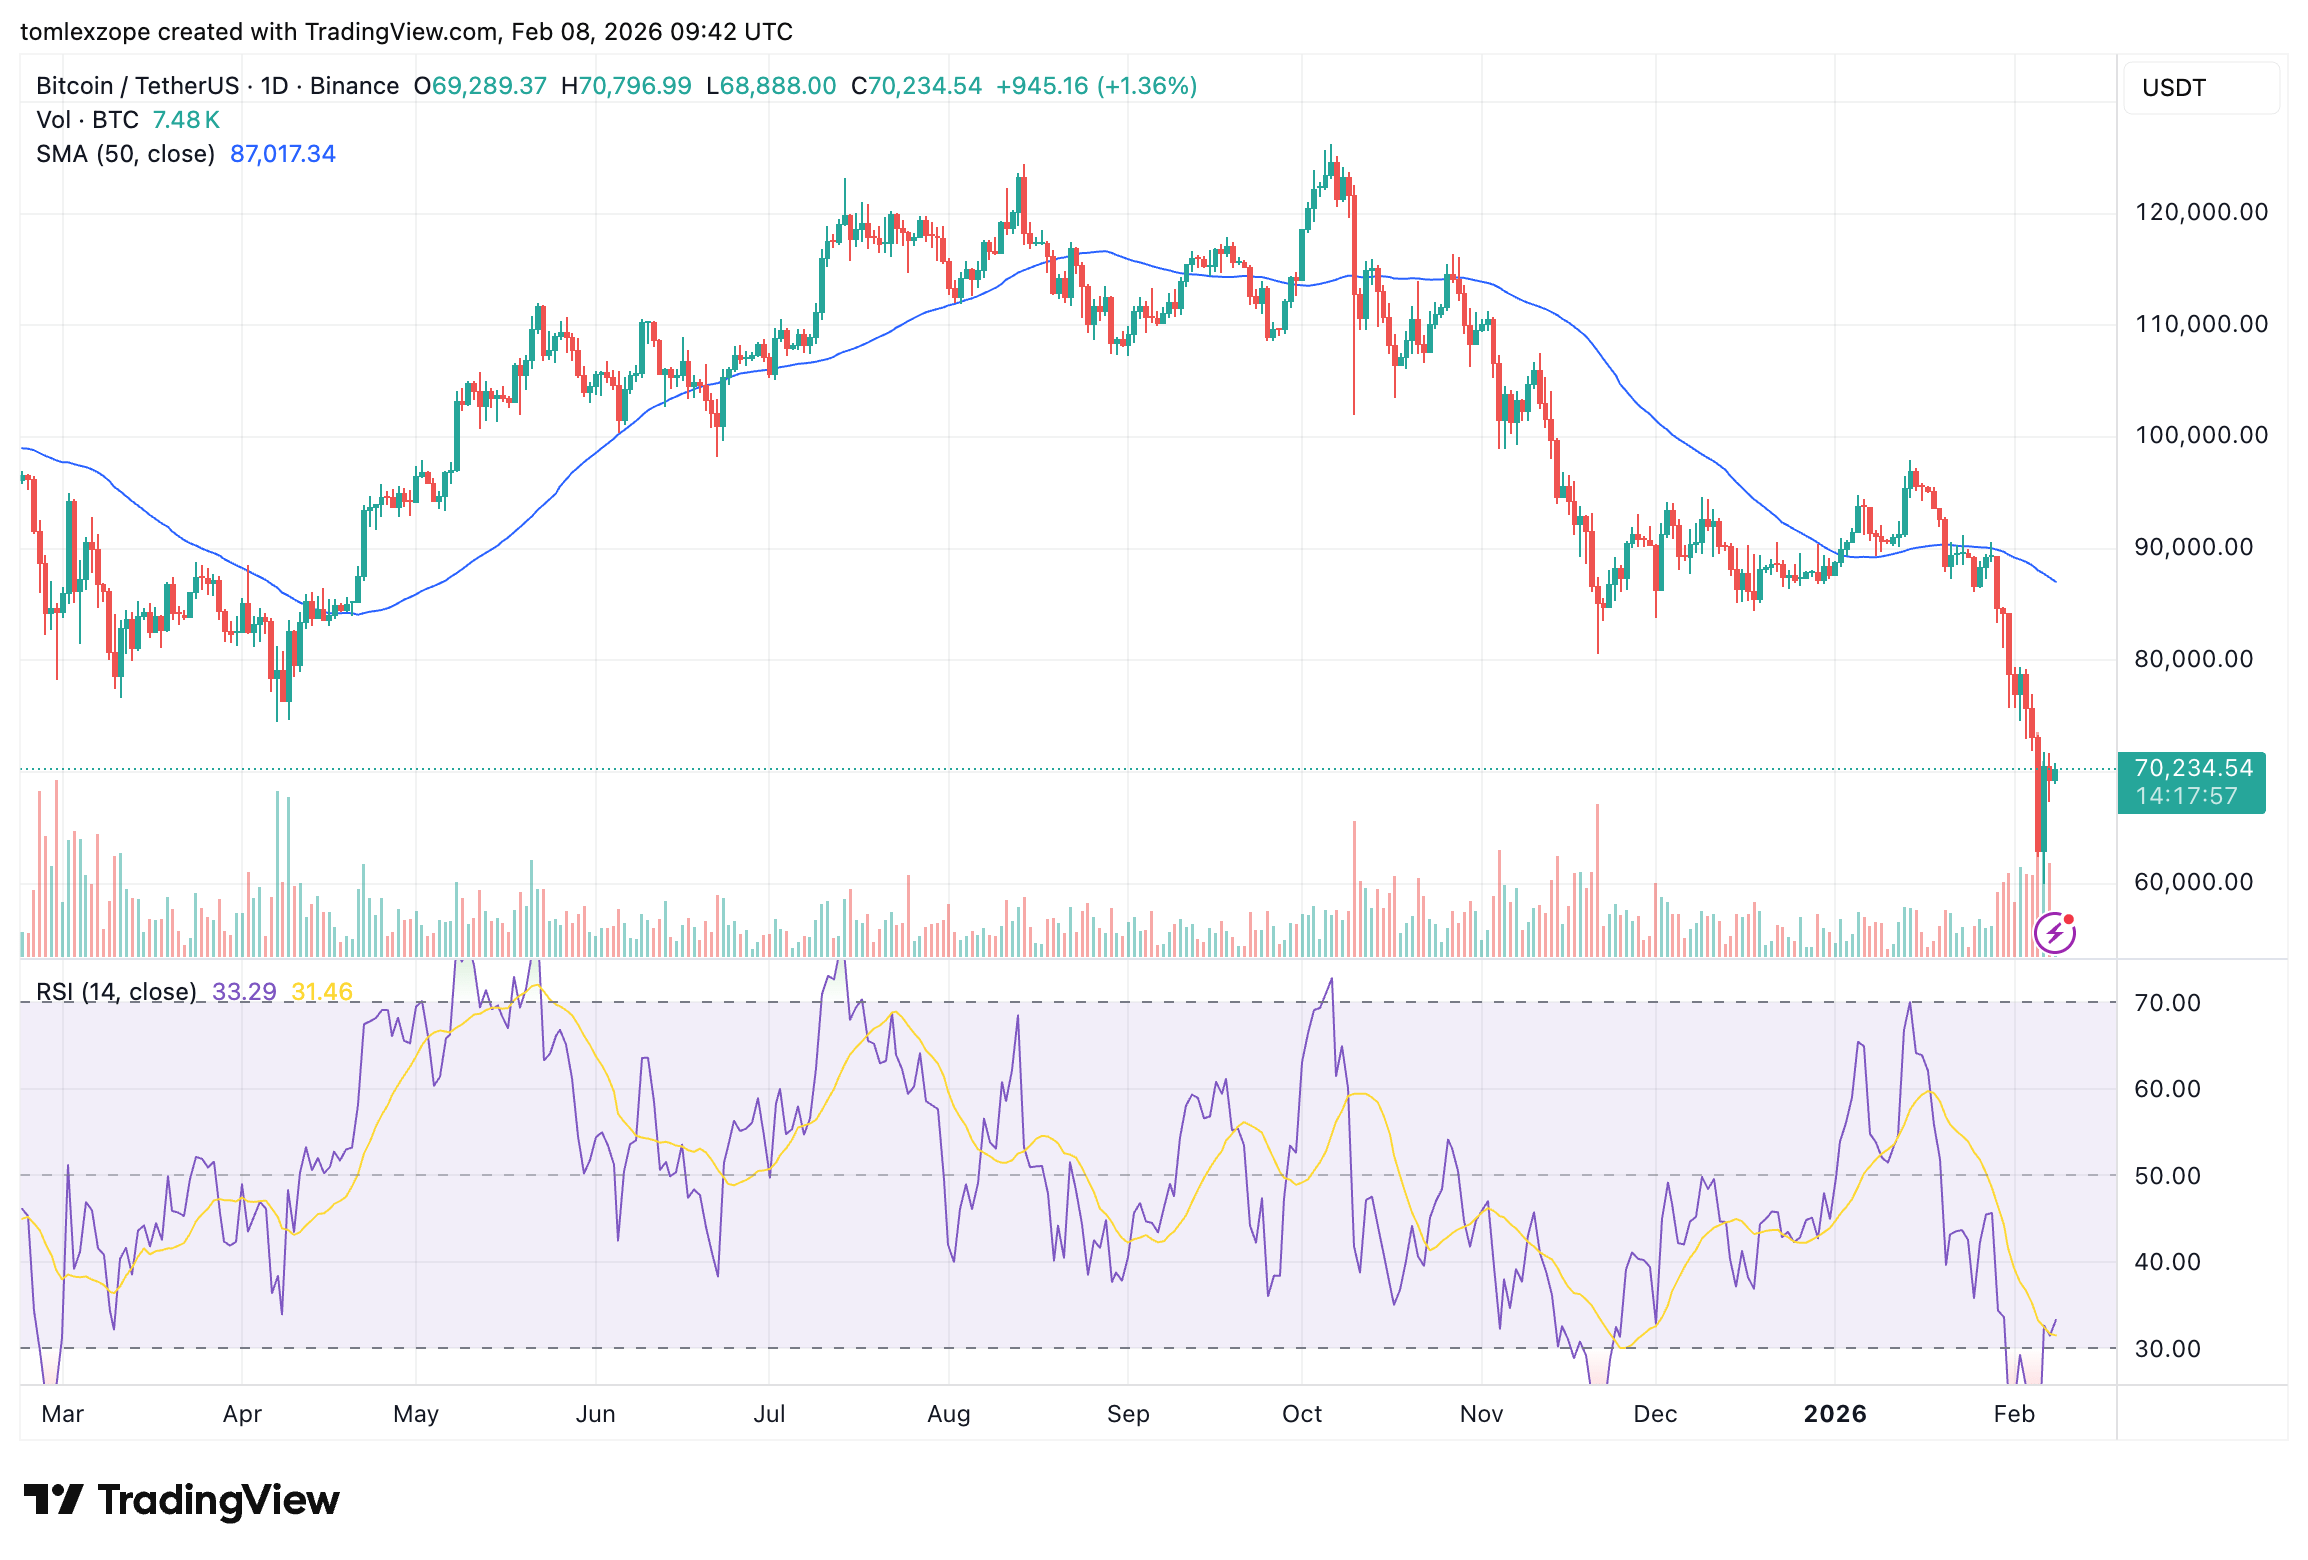
The daily BTC price chart | Source: BTCUSDT chart on TradingView
Image source: iStock, chart source: TradingView

bitcoinist’s editorial process focuses on delivering meticulously researched, accurate, and impartial content. We adhere to stringent sourcing standards, with each page undergoing thorough review by our team of top technology experts and seasoned editors. This rigorous process ensures the integrity, relevance, and value of our content for our readers.

Be the first to comment